Grid Dialog
On occasion you may need to lay out a grid on your maps for measurement purposes. The Grid Dialog will help you do this. While you can lay out grids without using the Grid Dialog, there is one instance where you will find it quite handy. If you don't want to take your computer with you out in the field, or if you don't have a laptop computer, you can still make use of the 1715 Fleet maps while at sea if you have a paper copy of the area you want to work in. Normally that would be a fairly small area. In this case, it's possible to lay a grid with Latitude and Longitude values over your area of interest, print it, and use it while at sea to find your position via GPS. See the Fixed Position Grids topic for details.
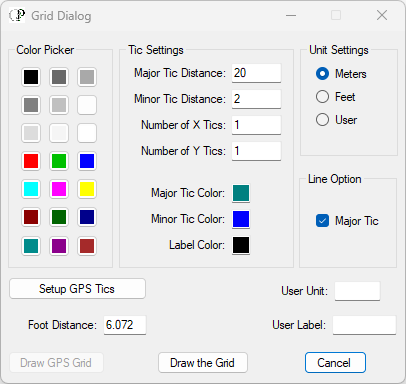
The Grid Dialog is seen here:
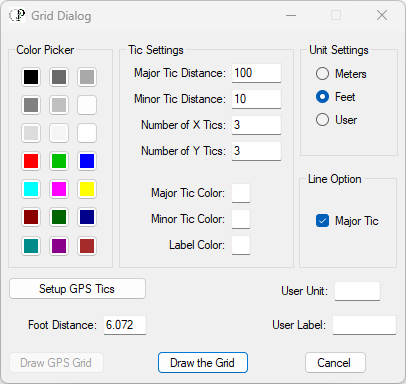
To access the Grid Dialog, use the TOOLS MENU on the Menu Bar. You see it here as loaded and by default it's set up to produce a grid 300 feet across in the north and 300 feet in the east, using three major squares 100 feet in length with minor tics every 10 feet. The grid drawn by the Grid Dialog always originates at the lower left corner, which is the southwest corner of the grid. Generally it is a good idea to add a layer to the map/drawing specifically for grids... you might name the layer "Grids", and leave it as the only unlocked layer in the drawing. Lock all the other layers, or turn off the visibility of those you do not want to print on paper if you intend to print your grid image.
Once you have the Grid Dialog visible and your cursor is at the point in the Map Window where the lower left extent of your intended grid will be, RIGHT CLICK. This will drop the cursor at that position. Ignore any pop-up menus that appear. Now adjust the Grid Dialog as necessary and click on the button labeled "Draw the Grid".
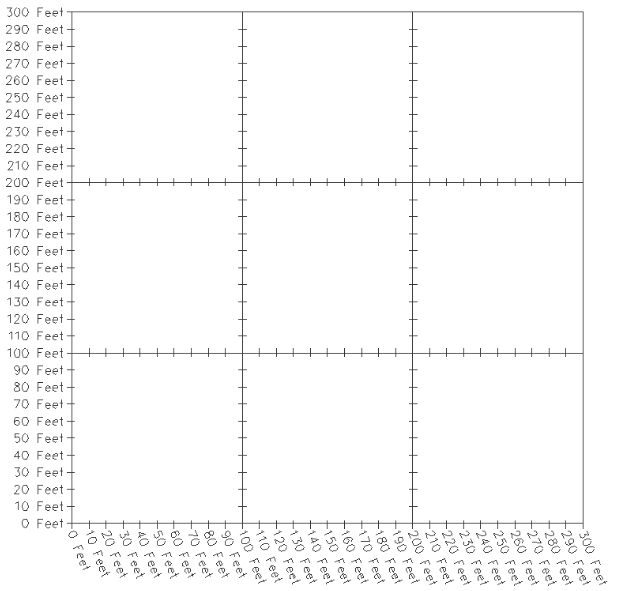
Note in the example above that the Major Tic Color will be black as will the Minor Tic Color and the Label Color. Be aware that the background color of the Map Window must be something other than black if you want to see your grid using the color black. If you used the black color for tics and labels as shown above, and you changed your Map Window background color to white (see Drawing Background Color on the OPTIONS MENU), the grid would look like this:
Let's say you are interested in producing a grid in meters. To do that, you would adjust the Grid Dialog as seen below.
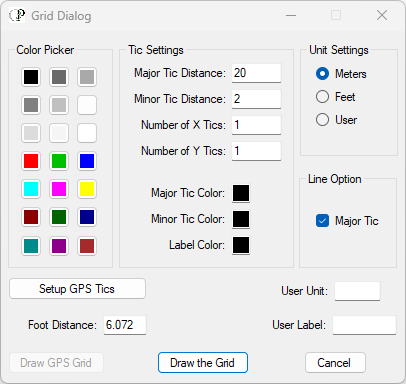
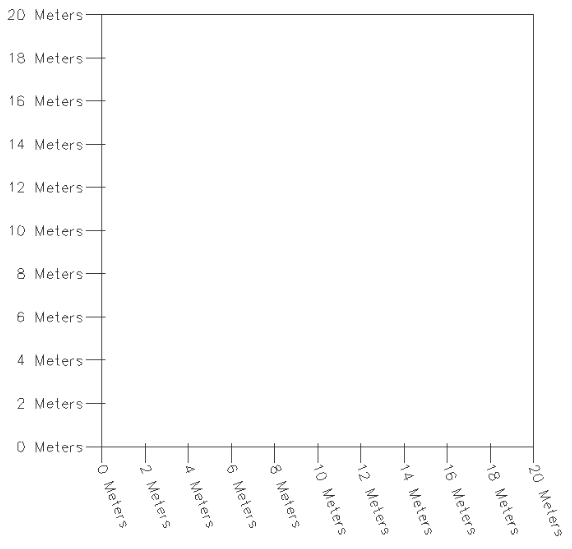
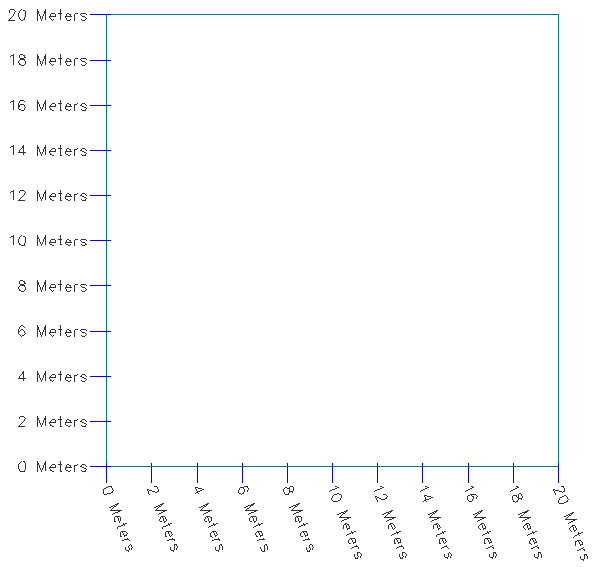
The Unit Settings are set at Meters, the Major Tic Distance will be 20 Meters, the Minor Tic Distance is set at 2 Meters, and there will be a single Major Tic to the north and a single Major Tic to the east. The colors are still black in this case. The resulting grid will look like this:
Let's use the same setup, but this time let's change the colors of the Major Tic, the Minor Tic, and the Label. This is done by first clicking in the Color Picker Panel on the color of choice and then clicking on the color box of the Major Tic, the Minor Tic, or the Label.
The result is shown below. Generally when using a white background you need to stick with dark colors for your grid, especially the Label. If you use a typical laser printer for your printing jobs, the colors will make little difference.
All of the samples shown in this topic can be selected and moved wherever you like in the Map Window. The Fixed Position Grids are based on Latitude and Longitude values and must remain stationary where you construct them. For instructions on building Fixed Position Grids go to the Fixed Position Grids topic.