Official Wreck Map Details
The current, official map files maintained digitally by Queen's Jewels LLC use AutoCAD, a Computer Aided Drafting program produced by the AutoDesk company. AutoCAD is the premier CAD program with a long history of development dating back some thirty years. Over the years the program has assumed new functionality as a three dimensional (3D) drafting product, but the 1715 Fleet wreck charts are wholly recorded in two dimensions (2D). There are variants of the AutoCAD program designed specifically for map production, but the competition from the ESRI company with their flagship product, ArcMAP generally rules the computerized mapping business. The products from these two companies, ESRI and AutoDesk, have produced the essential file formats used by both products simultaneously. File formats between the two are interchangeable to some degree, and that finesse varies from year to year as the programs evolve.
There are three primary root products used by AutoCAD and ArcMAP:
- DWG is the native AutoCAD file format, which is the file format maintained by 1715 Fleet map administrators from the beginning of their first map publications, first by Treasure Salvors, and later by Queen's Jewels LLC.
- DXF is a Data Exchange Format originally produced by AutoDesk. While DWG is a proprietary format, DXF is a format exploited by other software vendors where their products need to have some means of making use of AutoDesk files.
- SHP is the ESRI shapefile format and is usually composed of five distinct files acting as a single native file format to portray a map. SHP is also considered to be the data exchange format produced by ESRI and it can be rendered by many CAD programs. Likewise, ESRI products are capable of rendering DXF format files.
DigFindR can read and write DXF, but once these files are interpreted, the data is stored and managed in the native DigFindR file format, LCD, a contraction of "LiteCAD" format.
Both the SHP and DWG file formats have features that can only be used by their parent programs. In the case of the DWG format, there are key elements of the 1715 Fleet maps which are only available to programs that read DWG, those being the attributes of the excavation symbols. Those attributes stored in the excavation symbols on the maps are seen below in a DigFindR inquiry. This message box showing the attributes of that selected attribute moniker will appear when you click on it inside the excavation symbol:
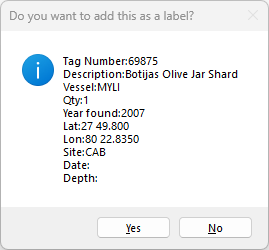
Be aware that DXF does not support these attributes. DXF can be used to exchange entity data only. Nothing embedded in the DWG is transportable via DXF. In a similar fashion, the tabular data contained in a SHP file can not be rendered by a CAD program unless it has specific utility for that purpose.
Generally speaking almost all map data produced by government offices today is hosted in an ESRI format of one sort or another. Fewer data sets are available in DWG or DXF.
Map Components
There are six major components to the 1715 Fleet maps:
- Shoreline
- Beach markers
- Grids
- Excavation symbols
- Excavation attributes
- Raster imagery
There are no scales per se in the maps, as there are grids of various types representing latitude and longitude, metered in different scales. However, in DigFindr, the entire grid system is registered in foot distance so determining distance in feet, meters and miles is no problem.
There is no north arrow in the maps as north is always the upper edge of the map as it was originally drawn. North is always Up, South is always Down, West is the left side of the the map, and East is always the right side of the map.
The shoreline in the maps is a government product known as a Digital Line Graph. This product is universal throughout the United States, manufactured by the U.S.G.S. in three scales. The DLG shoreline found in the 1715 Fleet maps was imported into the maps in 1990 as DXF. Digital Line Graphs (DLG's) are vector lines. All the entities in CAD are vector lines.
When Florida's government got into the business of managing the 1715 Fleet leases, they erected some markers along the shoreline. The intent was to provide state agents with fixed datum points to take bearings on from the decks of the excavation vessels. This data was not shared with the salvors. Real 8 crews did not record their excavations or finds via positions taken using these markers, therefore, basically none of the original Real 8 finds can be geographically referenced. Even the state inspectors failed to make use of the markers themselves on most occasions. The markers were torn down by vandals, or blown down in storms. Mel Fisher was more concerned with locating and referencing discoveries and subsequently devised several schemes for that purpose. After Fisher took over the 1715 Fleet leases in 1983, markers were re-established and those are the symbols shown in the maps. Be aware that from 1977 throughout 1982, other salvors made admiralty arrests on the wrecks and excavated them as had Real 8 and Treasure Salvors before them, but at this time all of these actors kept their own records, and those excavations are not recorded in the 1715 Fleet maps. From 1983 through 2000, salvors used sextant bearings taken against any three beach markers to establish their position while performing excavations. Many of these records are questionable as the farther from shore one gets, the less accuracy can be achieved while using the sextant. However, there are many thousands of records in the maps established using a sextant.
The latitude and longitude grids in the maps are accurate to a great degree. Once GPS became the established method of position recording circa 2000, the beach markers were no longer relevant and grids were used to plot excavations using latitude and longitude. The finer grids add a tremendous amount of data to the file size of any given map, and have been removed from the LCD version of the files to save on overall file size (in bytes), which speeds up the loading and panning of the map data to a great degree. Because DigFindR supports real-time position of the cursor in the Map Window, the grids are no longer necessary. At one point, when the maps were provided to contractors as paper charts, these very articulate grids were needed to plot position. Now that contractors have the digital map product at their disposal, rather than a paper chart, such is not the case.
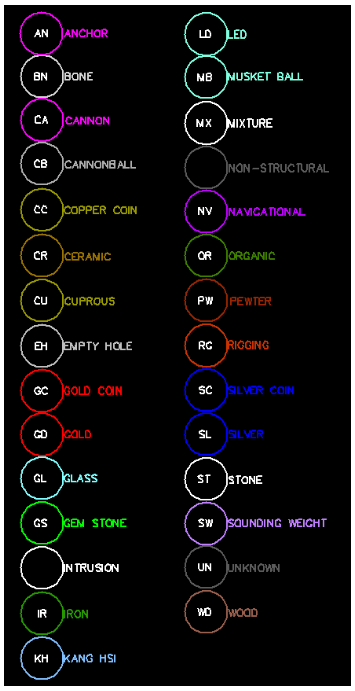
Excavations are represented in the official digital DWG maps by circles of a uniform diameter, with varying color. The circles are about 22 feet in diameter and symbolize the approximate location where an excavation occurred. The circles are color-coded, indicating what might have been found within the confines of that particular circle. For example, silver items are blue circles and gold items are red circles. This scheme translates into 29 item types, with some types sharing the same color with other unrelated types. This limited color key is based upon what colors were available to the pen plotting devices used to plot out the maps on paper when they were first constructed in the early '90s.
Because any number of different items might be found within a given excavation, you will see attributes that seem to occupy the same excavation symbol. Actually, in these instances there are a number of excavation symbols of different colors containing their unique attribute information, but the circle symbols are on underlying layers and are not visible, being hidden by the topmost layer's circle symbol. The 2 characters with attendant numbers are the attribute data symbols for the excavation. The attribute data symbols, or "monikers", host a database record of sorts, as seen in the first illustration above. The moniker might have a number attached as seen below...
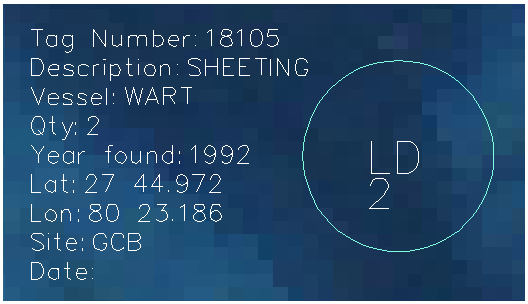
In this sample, the moniker is LD and the number is 2, meaning that 2 pieces of lead were found here. The complete attribute record has been added to the Map Window by using a feature unique to DigFindR, which is not natively available in AutoCAD. The complete attribute record contains ten fields (only nine are seen in the illustration).
One of the big drawbacks to this coding scheme is that the circle symbol you see in the Map Window will be the one in the topmost layer of the drawing. There might be a number of items identified with their own circle symbol of another color arranged in layers beneath the topmost layer; you won't see the circle, but you will see the attribute moniker. The only way to appreciate this would be to turn off the artifact layers that are atop the attribute layer you are looking for. Subsequently, you would not be aware of other items found in the same excavation along with the item types you are looking for. If, for example, there were a number of silver coins in the excavation, and a number of iron artifacts found in the same hole, the layer for IR (iron artifacts) might sit on top of the layer for SC (silver coins). As a result the circle will be green instead of blue. Therefore, it is not really efficient to simply scan the maps looking for colors as a way of determining what was found in many locations throughout the wreckage. To be completely accurate in your estimates of where you might best find what you're looking for, you need to re-cast the attributes into the map. You can do this easily with DigFindR. The other option is to continually re-stack the layers using the Layers Order Tool.
Here is a key from one of the current official maps showing the monikers and the colors for the excavation symbols:
Aerial photos or other scanned graphic images can be added to the maps. The Fishers provided a set of very clear aerials that show the surrounding seafloor in the vicinity of the 1715 Fleet wrecks in great detail. However, these photos were taken in the '90s and the ocean bottom near shore changes dramatically over time. It is possible to obtain newer aerials from a number of sources, either through screen capture methods, or through direct purchase of imagery from government agencies or commercial vendors. These images may be provided with World Files, an accessory file that will situate the aerial in exact world space. DigFindR makes direct use of World Files.
There are also instances where the only existing map data, perhaps of historic importance to you, will only be available on paper. In these cases, you must either scan the image or take a digital photo of it, in order to add it into your computerized map. There are a substantial number of charts containing other excavation data or magnetometry data from years past that only exist on paper. They can be added to the 1715 Fleet maps at your discretion using DigFindR. Once positioned, you can add your own world file if you intend to use the same image in another map file, or pass the image to another user.