CAD Basics
Computer Aided Drafting (CAD) is one of the first technologies developed for personal computers dating back to the early 1980s. The pioneering company in the field was and is AutoDesk, the manufacturer of AutoCAD software. Around 1990 the Fishers began using AutoCAD 12 to construct two dimensional charts/maps of their lease holdings so they might keep track of which vessels had recovered artifacts and treasure from particular locations. These charts were stored as AutoCAD digital drawings in files with the .DWG extension, a native AutoCAD file format.
Originally CAD was developed as a means to produce mechanical drawings with great precision that were to be plotted onto paper using large plotters. These plots were generally on large sheets of paper we refer to as E-Size. In the '90s when the Fishers began building their AutoCAD maps, plotters generally were limited to using 16 colors, which is not the case today with modern ink-jet technology. Subsequently, the Fisher dig charts are keyed to 16 colors.
CAD is geometry-dependent, and space-dependent. Some understanding of geometry is necessary to use CAD effectively. The concept of space on a flat plane in the X and Y dimension (2D) is also something that a user must be acquainted with in order to effectively use the Fisher dig charts in the CAD environment. Maps are generally two-dimensional constructs, but the original Fisher maps have taken on a new attribute recently wherein the depth of water where excavations occur has been noted albeit not through geometry drawn in the DWG files themselves.
DigFindR does not use the AutoCAD DWG file directly, but uses a variant called a LiteCAD format, the .LCD. Therefore, to make use of DigFindR, you must have a modified DWG file stored in the LCD format.
The ability to show geographic coordinate values in real time on the computer screen is one of the most useful features of the DigFindR program. The objective of DigFindR is to make the maps immediately useful in the field where salvors can actually place themselves in the map according to where they actually want to be, based upon the history of excavations in a given area. This placement is dependent upon the use of GPS technology, something that was not available when the original excavation maps were conceived. The comprehension of coordinates and their GPS values is essential to understanding what you see in the 1715 Fleet excavation maps.
Absolutely everything that can be done on a paper map can be done using CAD, however, there are many things that can be done with a map in a CAD program that can not be done using a paper map. This would include the import of additional maps projected in various coordinate systems, and the overlaying of photo aerials that can be affixed to geometry in any number of combinations simultaneously.
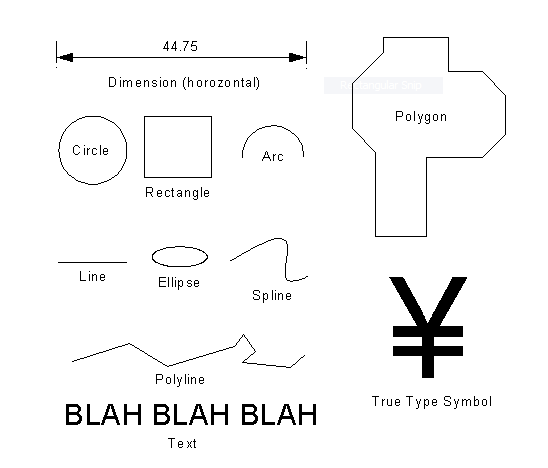
CAD (read 'DigFindR') draws lines between points to represent geometric entities. There are basic entities you can draw and each entity type has native characteristics you can control through the entity's properties. The basic entity types are:
- line
- circle
- arc
- ellipse
- rectangle
- polyline
- polygon
- text
- multi-line text
- hatch or fill
- construction lines
- dimensions
- symbols
- raster graphics
CAD uses several specific properties of entities to manage those entities within the map/drawing. Entities can be placed on layers within the map. Generally, the Fisher maps are laid out on as many as 40 + different layers. Layers can be locked for editing as desired, and they can be hidden from view or exposed to view as desired. The DigFindR program uses the LiteCAD Layers Dialog and the LiteCAD Layers Order utility to manage layers in the map.
CAD uses color as desired to manage entities, however, this scheme of management requires a universal design that is intentional. In the Fisher maps, you will find a key or legend that depicts the dig symbols by type and color. To use the 1715 Fleet dig charts you must have a color screen on your computer, and if you wish to print them out, you will need a color printer/plotter.
Entities exist in one of two states; they are in a selected state or they are not in a selected state. Before an entity can be modified or deleted, it must be in a selected state.
Entities can be of specific colors and their lines can be of specific line types.
All of these properties of entities can be managed through use of the Property Window. An entity must be in the selected state before its properties are available in the Properties Window.
Entities can be edited using the methods which are chosen from the pop-up Edit Menu. Once the entity(s) are in a selected state, a right click on the Map Window will present the pop-up Edit Menu.
In the selected state entities display handles and rotators. Using the mouse cursor, the pick box of the cursor can be used via the left mouse button to seize the handles or the rotators to perform edits.
The pick box and its ability to select handles and rotators of selected entities can be enhanced and controlled through the use of snap modes and an underlying grid in the Map Window.
Additionally, entities may be collected together in groups called blocks. In fact an entire map, or any other drawing for that matter, is considered to be a block entity.